In the different articles of the Weekly Gauge newsletter, it is possible to find many references to the Game Theory concepts that are used to describe the interactions between participants of the governance wars, in order to develop models of analysis and optimization of exchanges.
We discussed the pricing of ve-Boost in detail in Weekly Gauge #30 , this time we will try to establish another correlation between the data points at our disposal during the participation in the governance wars and thus quantify the expectations of return and the fair price of votes.
This article is an first step toward a wider theoretical research and aims to introduce its principles through the case study of the Curve/Convex voting incentives market.
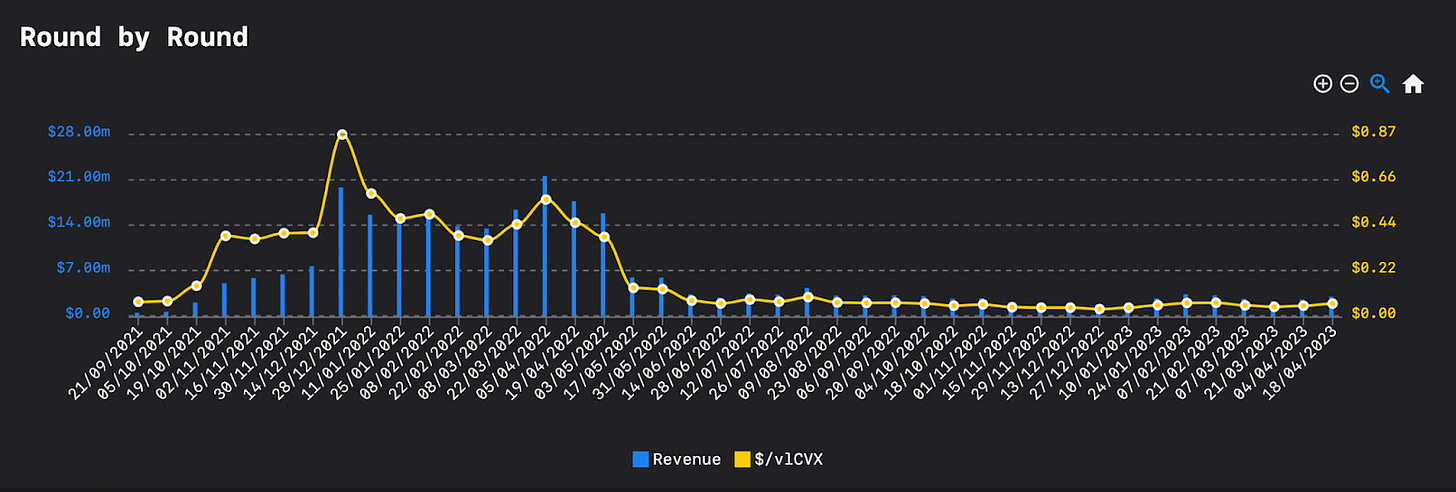
source : llama airforce
As the ecosystem matures it naturally reaches equilibrium and rationalizes the flywheel value, this is due to several factors :
Distribution of votes : Although the inflation is sustained by the relocking of newly emitted tokens, most of them are empirically compounded by major DAO holders significantly reducing the potential impact of newcomers in the distribution process.
Participation :
According to Convex’s Docs the inflation of its native token was designed such that rapid and early growth of the project in terms of scaling its control over veCRV, would result in a very quick augmentation of the CVX supply. Thus, the project became a major veCRV holder in the span of one year and all things being equal, the count of unique participants on one side of Curve’s voting incentive market tends to flatten as Convex has reached over 90% of circulating supply.
Intrinsic value :
While the value itself relies essentially on the market price action of the underlying CRV tokens, it is clearly visible that the gap in an equilibrium CVX/CRV ratio is narrowing over time.
https://dune.com/queries/1087787/1863323
Then, how to quantify the correlation in order to anticipate the efficiency of an incentive program ? This also works the other way round for voters willing to anticipate the best ROI among available incentives.
To make a very summarized introduction to the mathematical aspect of the problem, the three variables of interest here are : A the total incentive budget distributed for a specific round , B the total voters participating in this round, and C the final $/vote distributed.
At any time until the end of the voting period some of these are unknown and participants on both sides of the market are looking for a fair price for their respective assets.
Note that the ROI for bribers isn’t the main correlation factor here which provides a hint on the strategic incentive management of bribers as well as current state of the game, however, we will see that the variety of incentivized gauges play an more important role in the pricing of votes.
Going further we can include the historical CVX inflation parameters to scale down the first rounds in the same way as a logarithmic curve would do.
Source : https://dune.com/queries/2387663/3915837
Because we have determined that it is possible to anticipate the count of unique participants in a voting round, we will be able to dive deeper into the development of a prediction model. Stay tuned for the next article where we will try to quantify the correlation between Volume and $/vote on several ecosystems.


