Weekly Gauge #34 : About Yield and Volatility
Exploring sensitive factors of the governance wars
Volatility, or the degree of fluctuation in market prices over time, is a crucial risk measure that can impact investor returns and portfolio performance. In the context of the voting incentives market on top of Curve and Balancer protocols, we observe an interesting phenomenon where the underlying token used to incentivize voters and the lock rate overtime exhibit significant volatility, while the final Annual Percentage Rate (APR) for voters remains remarkably stable.
This article aims to explore the factors that contribute to this apparent disparity and provide insights into why the final APR for voters has very low volatility despite the inherent volatility of the underlying token and lock rate.
In order to provide a little more context to our analysis, we start from the postulate that it is relevant to distinguish two axes of volatility, whose impact can be measured differently. First, we will look at the $/vote ratio, and second, we will look at the role of the lock rate that we share at the end of each edition of the Weekly Gauge.
On $/vote
Since they are at the origin of the development of the voting markets, as we explained in Weekly Gauge #14, and since they represent the major part of the volume of incentives distributed, it seems relevant to refer to the Convex and Aura liquid lockers to deal with the $/vote issue.
Convex
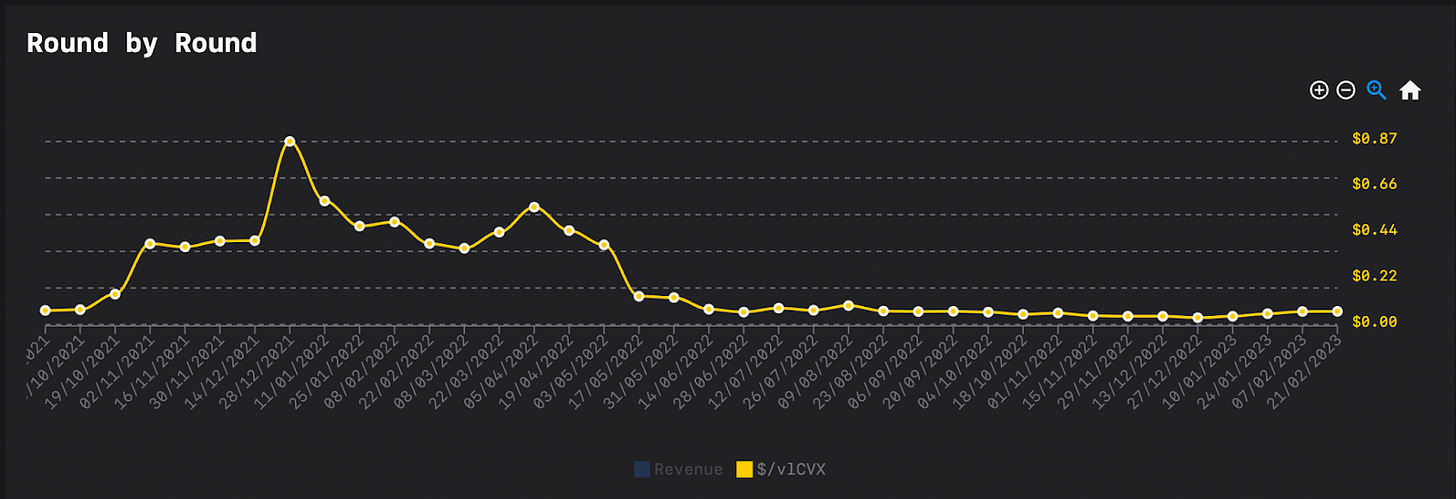
The first thing that jumps out when observing the evolution of incentives for vlCVX holders, is the strong correlation with the price charts of the tokens distributed to voters. However, this correlation seems to fade if not disappear from June 2022.
This can be explained by several factors, the recent appearance of the market as well as the variety of bribers necessarily implies a period of iterations in order to test its limits and its potential, in order to deduce its relative interest compared to the methods in existence until then.
However, it is very likely that tokenomics and especially the CVX inflation parameters are responsible for this initial period of high volatility.
Finally, we can hypothesize that the development of delegation systems such as Votium, as well as the presence of a leading incentive distributor, namely FRAX, has allowed the vlCVX market to find an equilibrium price and reach a certain maturity.
This can also be seen by the significant reduction in the standard deviation of $/vote in each round, which indicates the ability of bribers to agree on a consensus and equilibrium price for vlCVX.
Aura
Having emerged a few months later, and having escaped the numerous black swan events of the first half of 2022, the Balancer ecosystem voting market, led by vlAura, has a much less volatile round-by-round average history. However, the standard deviations of the $/vote ratio are largely exacerbated, demonstrating a lesser ability of bribers to define their budgets and objectives.
Indeed, we can observe a much more competitive market, with increased turnover and whose participants are often inclined to overpay votes compared to the emission they control. We can explain this in the same way as for Convex, through the distribution of the Aura token which encourages bribers to accumulate the token by betting on its appreciation over time.
Through this lens it appears relevant to remind our readers that gauge wars are not for the ones who come unprepared, unless they don't care about overpaying.
On lock rate
In contrast to the first part, it seems wise to focus the lock rate analysis on the underlying layer of the governance markets, the one directly responsible for the dilution of the voting power of each participant, as we introduced in the Weekly Gauge #31, composed of Curve veCRV and Balancer veBAL.
Curve
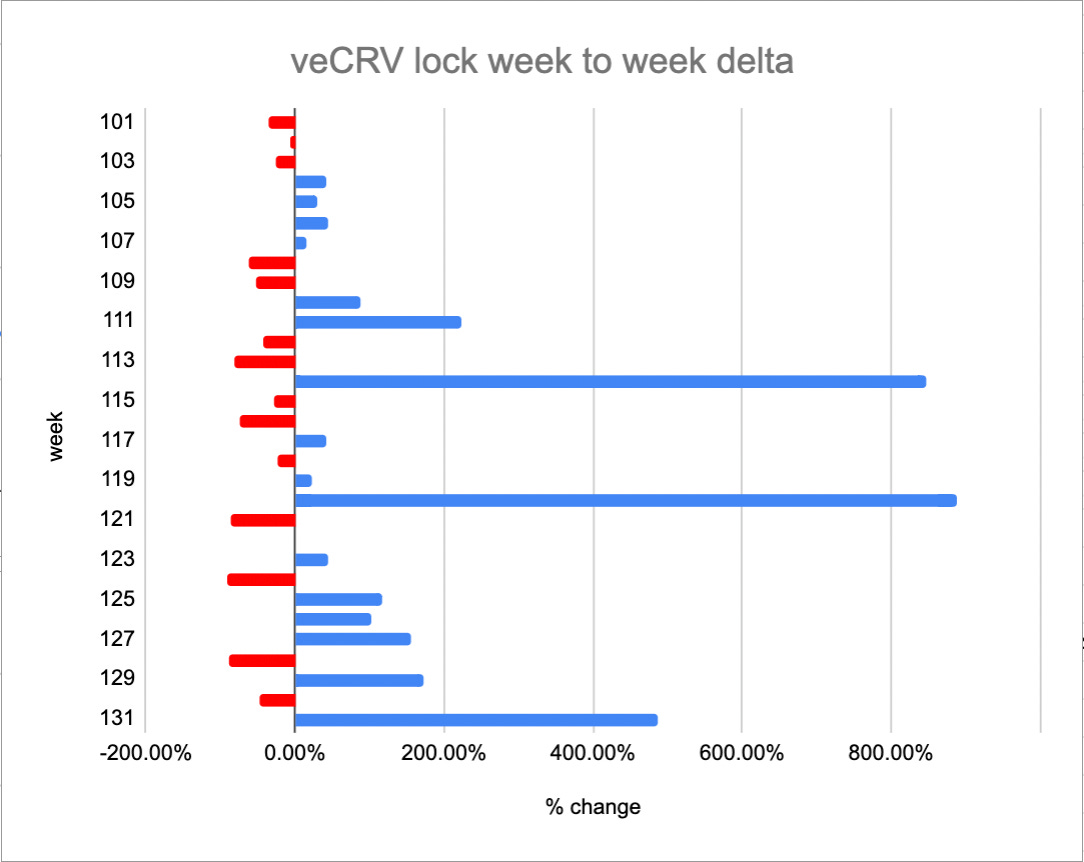
We can observe that the lock rate of the veCRV token varies greatly from week to week, however, it is rare to see it take a direction more than 2 weeks in a row which indicates the low correlation to market trends. This metric seems to be driven primarily by massive veCRV unlock events without posing a threat as they are quickly locked back in.
Balancer
We have already studied Balancer's strategy to incentivize the use of veBAL on several occasions.
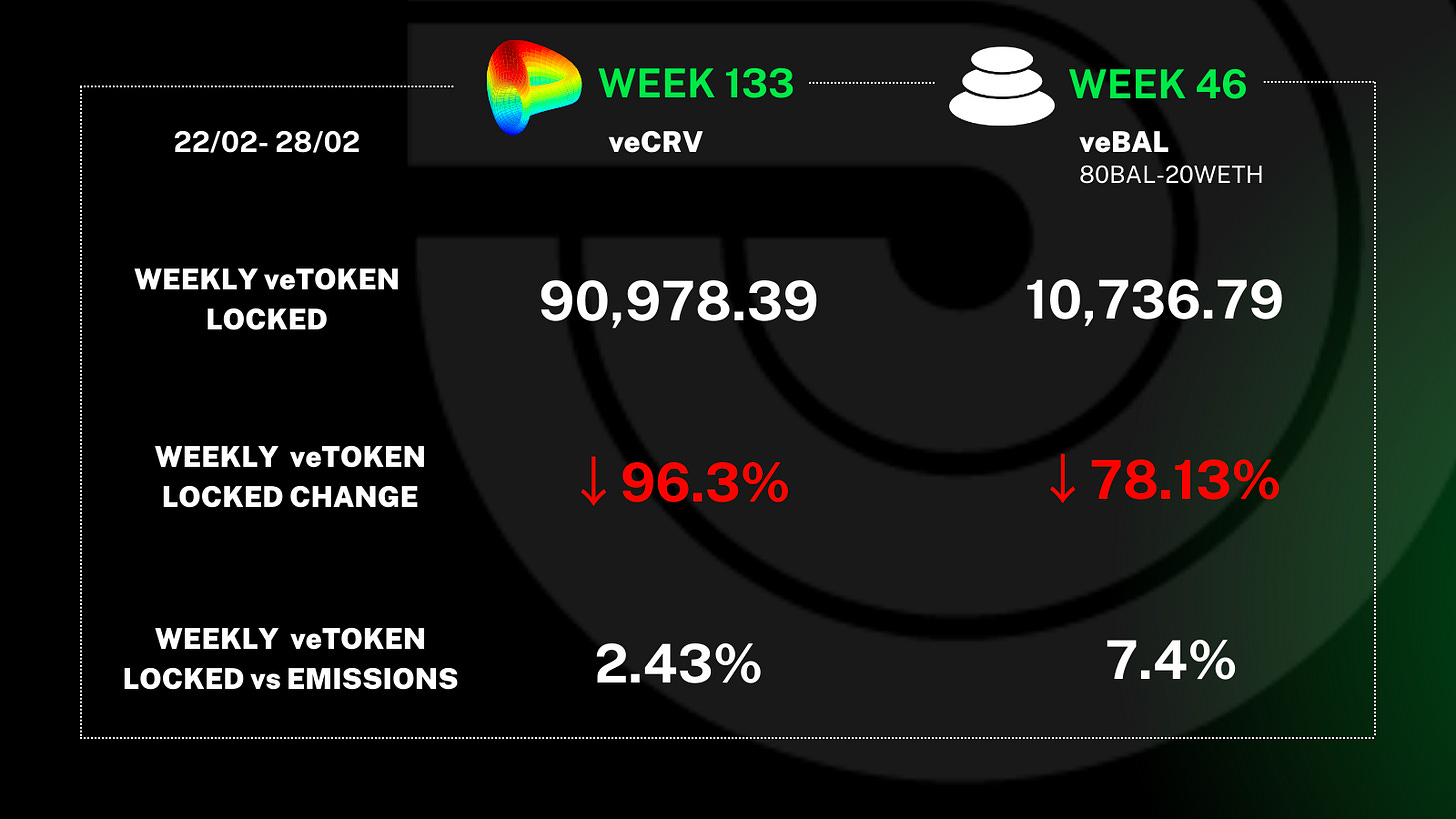
We can easily distinguish on the graph above the point at which this first bootstrap strategy of the veBAL gives way to a new policy of developing the Balancer governance, at week 34 after which the lock rate was never again higher than the emissions.
This transition also corresponds to the implementation of the peace treaty between the main stakeholders of this ecosystem, namely Balancer, Aura and the whale Humpy.
We can conclude this analysis by stating that the governance wars seem to be very sensitive to factors such as the number of participants, their seniority and the inflation rates of the coveted tokens.
Finally, it seems that despite the high volatility of the lock rate and $/vote metrics, they have a much more moderate impact on the final APR of the voter due to the strong correlation between the prices of governance tokens and those offered in incentives.


